|
474
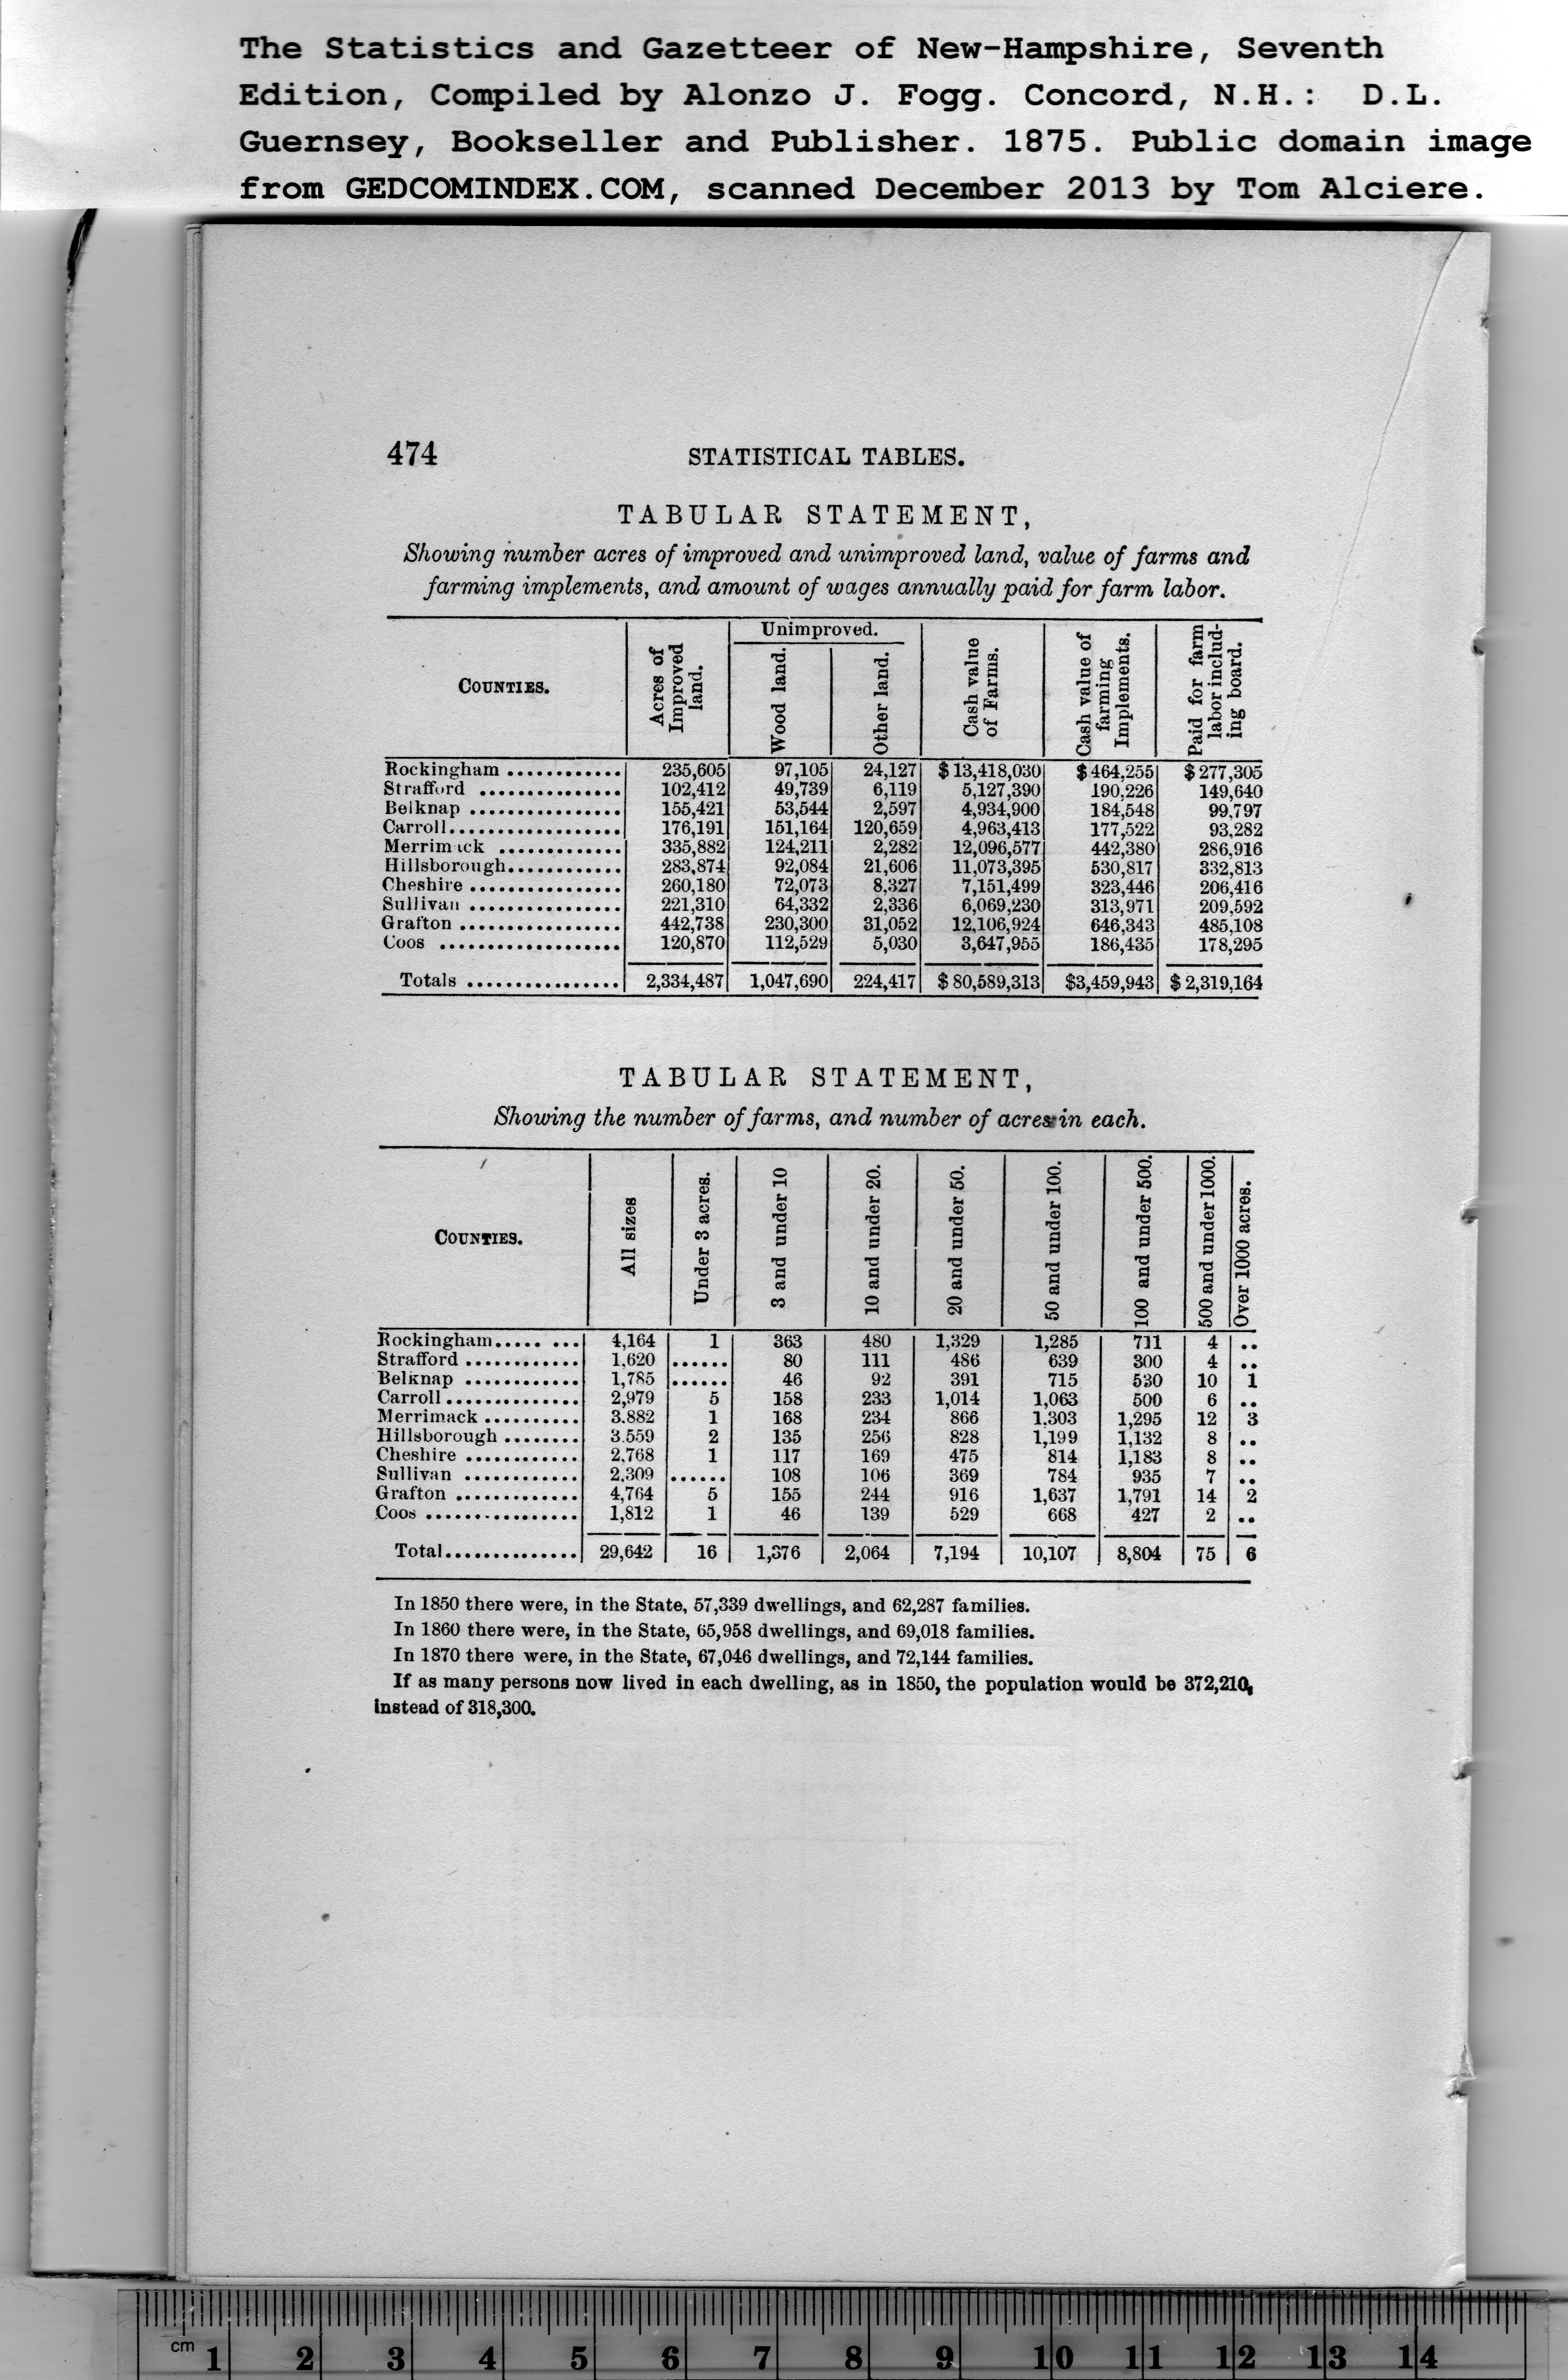
STATISTICAL TABLES.
TABULAR STATEMENT,
Showing number acres of improved and unimproved land, value of farms and
farming implements, and amount of wages annually paid for farm labor.
|
Counties. |
Acres of
Improved
land. |
Unimproved. |
Cash value
of Farms. |
Cash value of
farming
Implements. |
Paid for farm
labor includ-
ing board. |
|
Wood land. |
Other land. |
|
Rockingham............ |
235,605 |
97,105 |
24,127 |
$ 13,418,030 |
$464,255 |
$277,305 |
|
Strafford ............... |
102,412 |
49,739 |
6,119 |
5,127,390 |
190.226 |
149,640 |
|
Belknap................ |
155,421 |
53,544 |
2,597 |
4,934,900 |
184,548 |
99,797 |
|
Carrol 1.................. |
176,191 |
151,164 |
120,659 |
4,963,413 |
177,522 |
93,282 |
|
Merrimack ............. |
335,882 |
124,211 |
2,282 |
12,096,577 |
442,380 |
286,916 |
|
Hillsborough............ |
283,874 |
92,084 |
21,606 |
11,073,395 |
530,817 |
332,813 |
|
Cheshire................ |
260,180 |
72,073 |
8.327 |
7,151,499 |
323,446 |
206,416 |
|
Sullivan................ |
221,310 |
64,332 |
2,336 |
6,069,230 |
313,971 |
209,592 |
|
Grafton................. |
442,738 |
230,300 |
31,052 |
12,106,924 |
646,343 |
485,108 |
|
Coos ................... |
120,870 |
112,529 |
5,030 |
3,647,955 |
186,435 |
178,295 |
|
Totals................ |
2,334,487 |
1,047,690 |
224,417 |
$ 80,589,313 |
$3,459,943 |
$ 2,319,164 |
TABULAR STATEMENT,
Showing the number of farms, and number of acrestin each.
|
Counties. |
All sizes |
Under 3 acres. |
3 and under 10 |
10 and under 20. |
20 and under 50. |
50 and under 100. |
100 and under 500. |
500 and under 1000. |
|Over 1000 acres. | |
|
Rockingham........ |
4,164 |
1 |
363 |
480 |
1,329 |
1,285 |
711 |
4 |
|
|
|
1.620 |
|
80 |
ill |
486 |
639 |
300 |
4 |
|
|
|
1 785 |
|
46 |
92 |
391 |
715 |
|
10 |
1 |
|
Carroll.............. |
2,979 |
5 |
158 |
233 |
1,014 |
1,063 |
500 |
6 |
|
|
Merrimack.......... |
3.882 |
1 |
168 |
234 |
866 |
1.303 |
1,295 |
12 |
3 |
|
Hillsborough........ |
3.559 |
2 |
135 |
256 |
828 |
1,199 |
1,132 |
8 |
#. |
|
Cheshire............ |
2.768 |
1 |
117 |
169 |
475 |
814 |
1,183 |
8 |
,. |
|
|
2.309 |
|
108 |
106 |
369 |
784 |
935 |
7 |
|
|
Grafton............. |
4,764 |
5 |
155 |
244 |
916 |
1,637 |
1,791 |
14 |
2 |
|
Coos................ |
1,812 |
1 |
46 |
139 |
529 |
668 |
427 |
2 |
•• |
|
Total.............. |
29,642 |
16 |
1,376 |
2,064 |
7,194 |
10,107 |
8,804 |
75 |
6 |
In 1850 there were, in the State, 57,339 dwellings, and 62,287 families.
In 1860 there were, in the State, 65,958 dwellings, and 69,018 families.
In 1870 there were, in the State, 67,046 dwellings, and 72,144 families.
If as many persons now lived in each dwelling, as in 1850, the population would be 372,210^
Instead of 318,300.
PREVIOUS PAGE ... NEXT PAGE
This page was written in HTML using a program written in Python 3.2
|