|
(
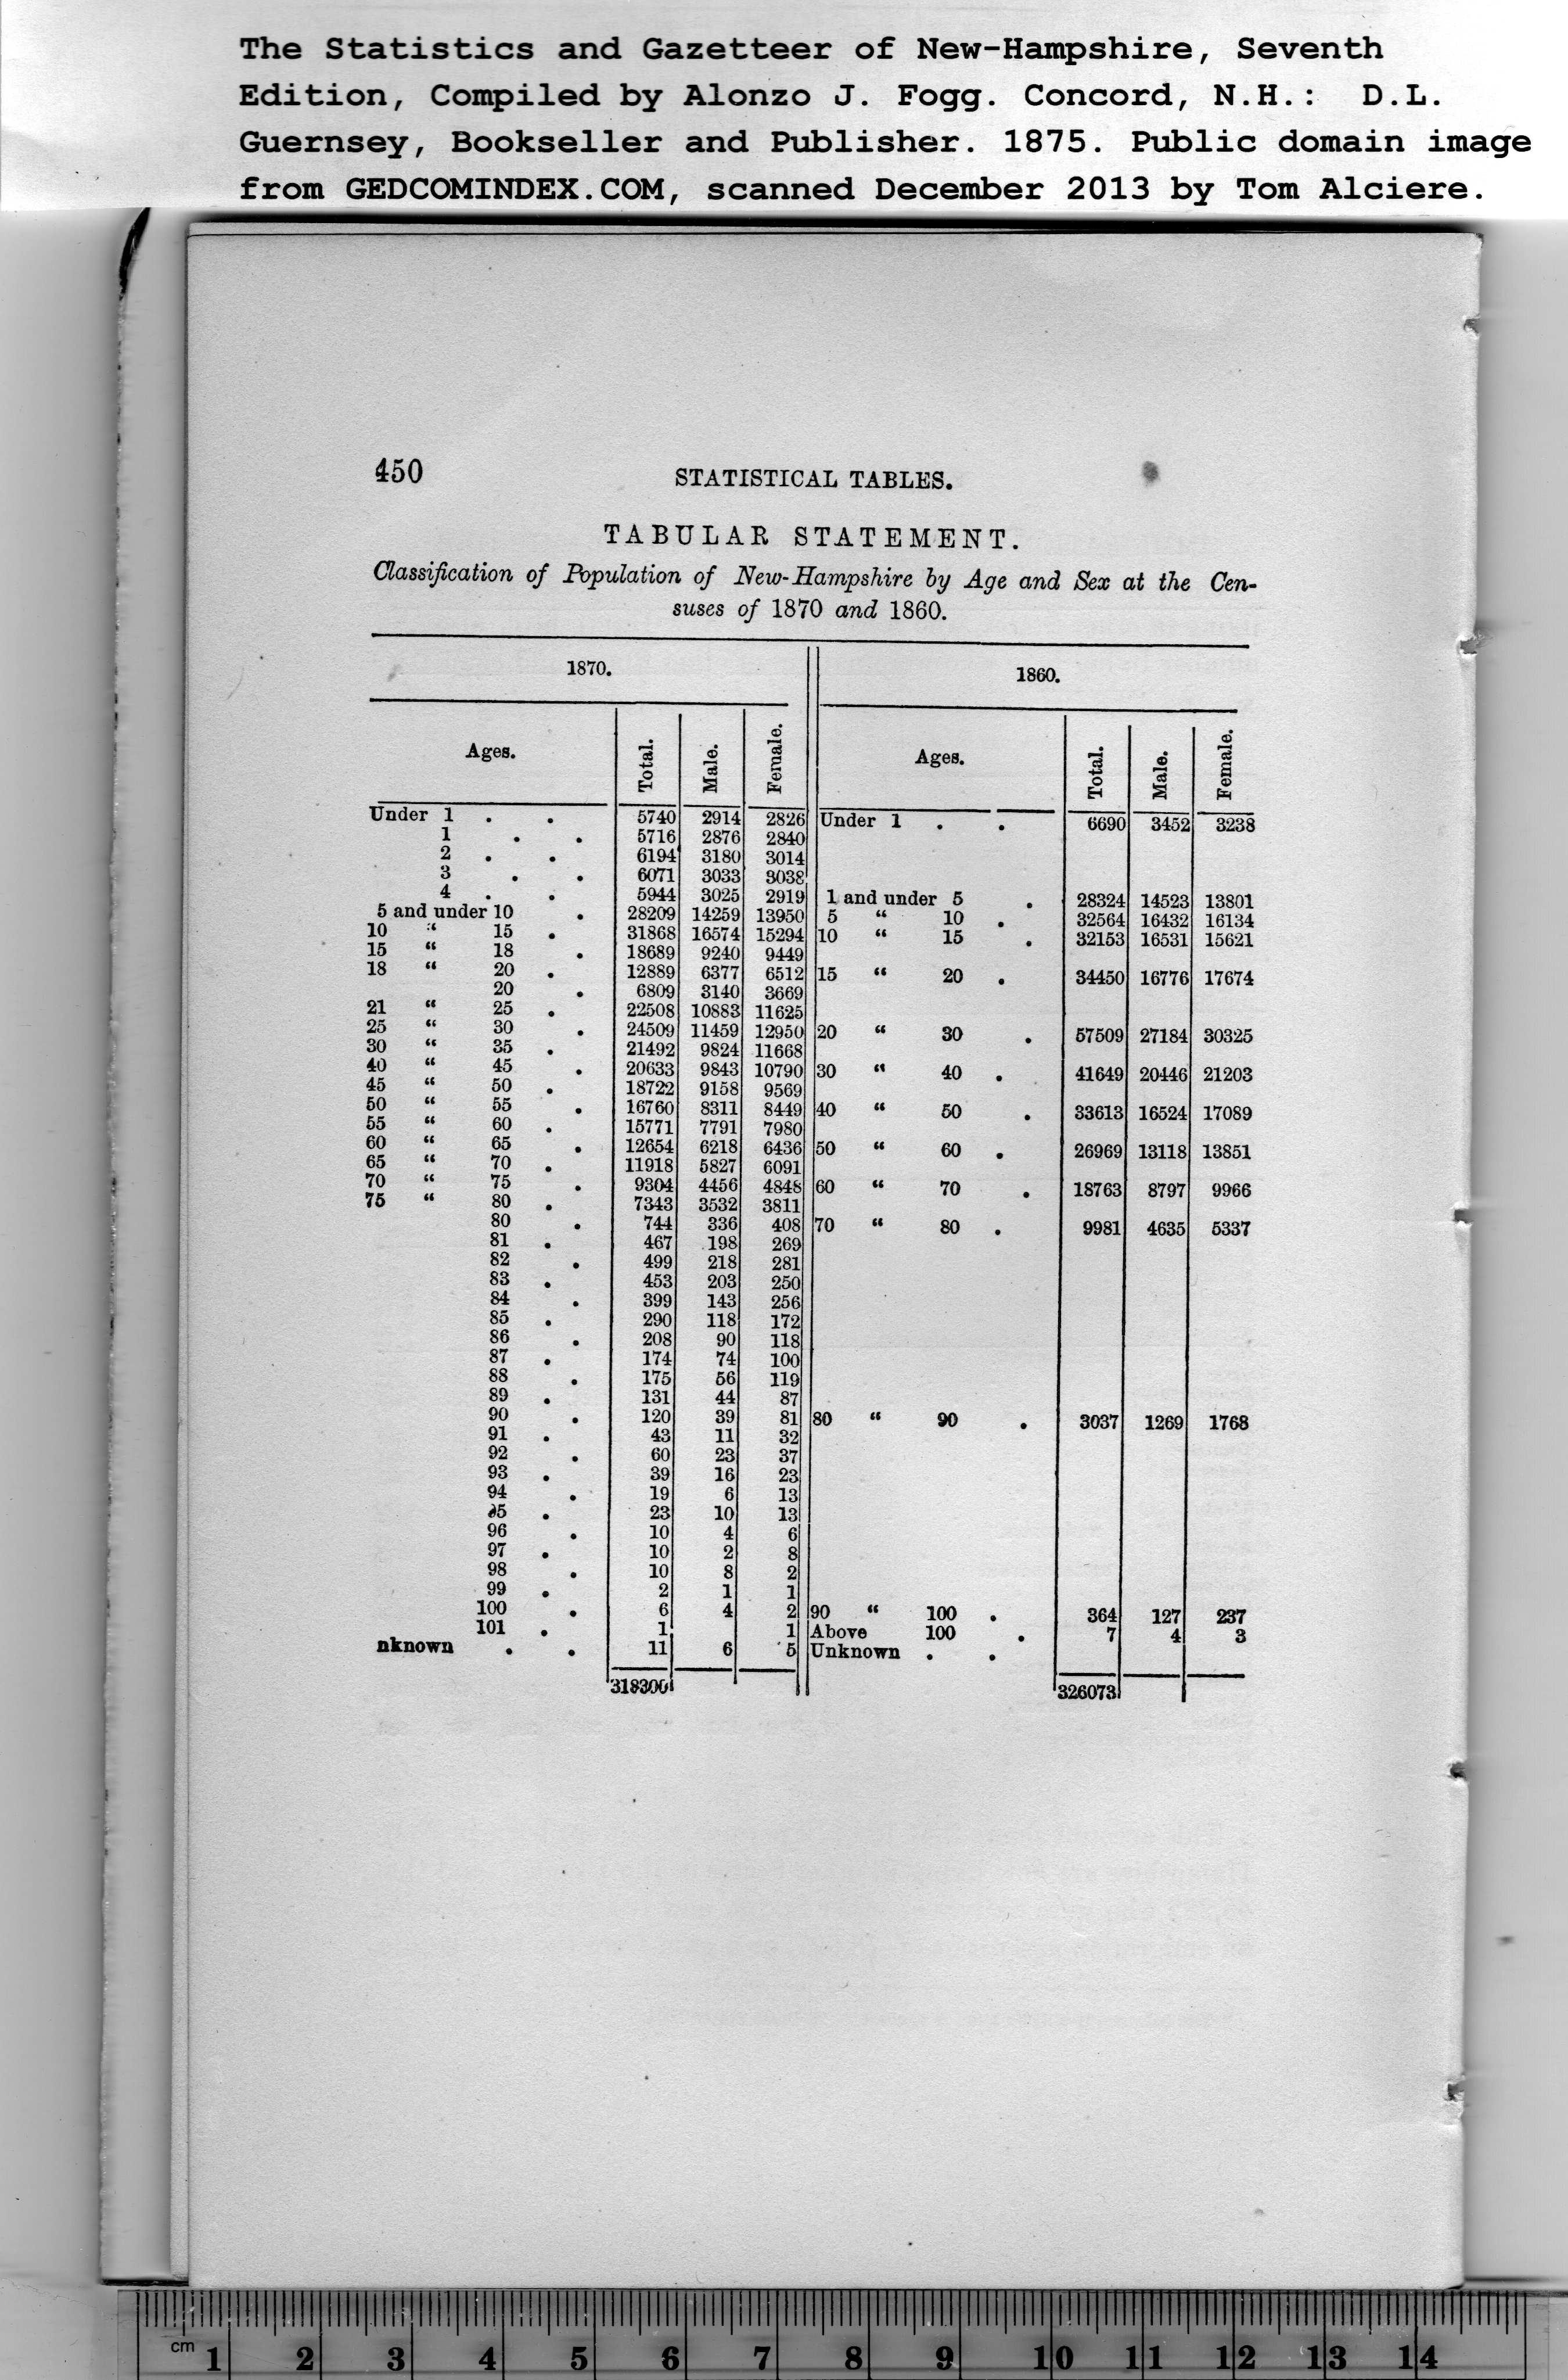
STATISTICAL TABLES.
TABULAR STATEMENT.
Classification of Population of New-Hampshire by Age and Sex at the Cen-
suses of 1870 and 1860.
|
1870. |
1860. |
|
Ages. |
Total. |
Male. |
Female. | |
Ages. |
Total. |
Male. |
Female. J |
|
Under |
1 |
|
5740 |
2914 |
2826 |
Under 1 |
|
6690 |
3452 |
3238 |
|
|
1 |
. . |
5716 |
2876 |
2840 |
|
|
|
|
|
|
|
|
2 |
. . |
6194 |
3180 |
3014 |
|
|
|
|
|
|
|
|
3 |
. . |
6071 |
3033 |
3038 |
|
|
|
|
|
|
|
|
4 |
|
5944 |
3025 |
2919 |
1 and under 5 |
28324 |
14523 |
13801 |
|
5 and nnder 10 . |
28209 |
14259 |
13950 |
5 |
“ |
10 . |
32564 |
16432 |
16134 |
|
10 |
|
15 |
31868 |
16574 |
15294 |
10 |
M |
15 |
32153 |
16531 |
15621 |
|
15 |
|
18 |
18689 |
9240 |
9449 |
|
|
|
|
|
|
|
18 |
|
20 .
20 |
12889
6809 |
6377
3140 |
6512
3669 |
15 |
ft |
20 . |
34450 |
16776 |
17674 |
|
21 |
|
25 |
22508 |
10883 |
11625 |
|
|
|
|
|
|
|
25 |
|
30 |
24509 |
11459 |
12950 |
20 |
a |
30 |
57509 |
27184 |
30325 |
|
30 |
|
35 . |
21492 |
9824 |
11668 |
|
|
|
|
|
|
|
40 |
|
45 |
20633 |
9843 |
10790 |
30 |
ct |
40 . |
41649 |
20446 |
21203 |
|
45 |
|
50 . |
18722 |
9158 |
9569 |
|
|
|
|
|
|
|
50 |
|
55 |
16760 |
8311 |
8449 |
40 |
w |
50 |
33613 |
16524 |
17089 |
|
55 |
|
60 . |
15771 |
7791 |
7980 |
|
|
|
|
|
|
|
60 |
|
65 |
12654 |
6218 |
6436 |
50 |
u |
60 . |
26969 |
13118 |
13851 |
|
65 |
|
70 . |
11918 |
5827 |
6091 |
|
|
|
|
|
|
|
70 |
|
75 |
9304 |
4456 |
4848 |
60 |
u |
70 |
18763 |
8797 |
9966 |
|
75 |
|
80 |
7343 |
3532 |
3811 |
|
|
|
|
|
|
|
|
|
80 |
744 |
336 |
408 |
70 |
M |
80 . |
9981 |
4635 |
5337 |
|
|
|
81 . |
467 |
198 |
269 |
|
|
|
|
|
|
|
|
|
82 |
499 |
218 |
281 |
|
|
|
|
|
|
|
|
|
83 . |
453 |
203 |
250 |
|
|
|
|
|
|
|
|
|
84 |
399 |
143 |
256 |
|
|
|
|
|
|
|
|
|
85 . |
290 |
118 |
172 |
|
|
|
|
|
|
|
|
|
86 |
208 |
90 |
118 |
|
|
|
|
|
|
|
|
|
87 . |
174 |
74 |
100 |
|
|
|
|
|
|
|
|
|
88 |
175 |
56 |
119 |
|
|
|
|
|
|
|
|
|
89 |
131 |
44 |
87 |
|
|
|
|
|
|
|
|
|
90 |
120 |
39 |
81 |
80 |
11 |
90 |
3037 |
1269 |
1768 |
|
|
|
91 . |
43 |
11 |
32 |
|
|
|
|
|
|
|
|
|
92 |
60 |
23 |
37 |
|
|
|
|
|
|
|
|
|
93 . |
39 |
16 |
23 |
|
|
|
|
|
|
|
|
|
94 |
19 |
6 |
13 |
|
|
|
|
|
|
|
|
|
iS |
23 |
10 |
13 |
|
|
|
|
|
|
|
|
|
96 |
10 |
4 |
6 |
|
|
|
|
|
|
|
|
|
97 . |
10 |
2 |
8 |
|
|
|
|
|
|
|
|
|
98 |
10 |
8 |
2 |
|
|
|
|
|
|
|
|
|
99 |
2 |
1 |
1 |
|
|
|
|
|
|
|
|
|
100 |
6 |
4 |
2 |
90 |
11 |
100 . |
364 |
127 |
237 |
|
|
|
101 . |
1 |
|
1 |
Above |
100 |
7 |
4 |
3 |
|
nknown |
• |
11 |
6 |
6 |
Unknown |
• |
|
|
|
|
|
|
|
318300 |
|
|
|
|
|
326073 |
|
|
PREVIOUS PAGE ... NEXT PAGE
This page was written in HTML using a program written in Python 3.2
|