|
Amount of American as compared with Foreign Tonnage at
different periods in the District of New York. |
|
Tears.
* |
; Tonnage Entered. |
|
U.S. |
Foreign. |
Total. |
|
1825 |
259,524} |
20,655} |
280,179} |
|
1830 |
280,918 |
33,797} |
314,715} |
|
1835 |
373,465 |
90,999 |
464,464 |
|
1840 |
409,458 |
118,136 |
527,594 .. |
|
1845 |
472,491} |
140,858} |
613,350 |
|
1850 |
807,580} |
441,756 |
1,249,837 |
|
, 1854 |
1,442,2783 |
477,034} |
1,919,31-3} |
|
1858 |
2,411,087 |
1,124,020 |
3,535,107 |
|
|
Tonnage Cleared. |
|
Tears. |
|
|
|
|
|
US. |
Foreign. |
Toted. |
|
1825 |
245,512 |
17,914} |
263,430} |
|
■ 1830 |
209,598} |
33,686} |
273,285 |
|
1835 |
289,551f |
80,038} |
369,590 |
|
1840 |
275,393} |
117,204 |
392,597} |
|
1845 |
377,163} |
140,222} |
517,385} |
|
1850 |
705,162 |
407,054 |
1,112,216 |
|
1855 |
1,082,799} |
445,305 |
1,528,104} |
|
1858 |
2,152,835 |
1,132,568 |
3,285,403 |
|
|
Amount of Registered, Enrolled, and Licensed Tonnage in the
several Collection Districts, June 30, 1858. |
|
Districts. |
Registered. |
|
Sag Harbor...........................
New Tork.............................. |
7,408.72
841,685.35 |
|
|
|
|
|
|
|
|
|
|
|
|
|
|
|
|
|
|
|
Buffalo Creek......................... |
|
|
|
|
|
|
|
Enrolled
and
Incensed. |
|
Amount of Registered and Enrolled Tonnage of the United States
and District of New York at different periods. |
|
Tears. |
Registered. |
Enrolled and Li¬
censed. |
|
U. States. |
N. York. |
U. States. |
N. York. |
|
1827..............
1832...............
1837...............
1842...............
1847... ............
1852. ..............
1858............... |
747,170
686,990
810,447
975,359
1,241,313
1.899,448
2,499,550 |
133,403
116,395
169,050
193,911
254,541
496,507
841,685} |
873,438
. 752,460
1,086,237
1,117,035
1,597,733
2,238,992
2,550,742 |
165,542
162,419
216,351
247,023
337,381
445,674
593,600 |
|
Number of Entries of Merchandise at the Port of New York for
10 years, ending June 30, 1856.
7,057
593,599.
888.
11,866,
6.129.
1,321.
46,420.
3,704.
1,272.
73,478.
5,382.
NEW YORK STATE GAZETTEER.
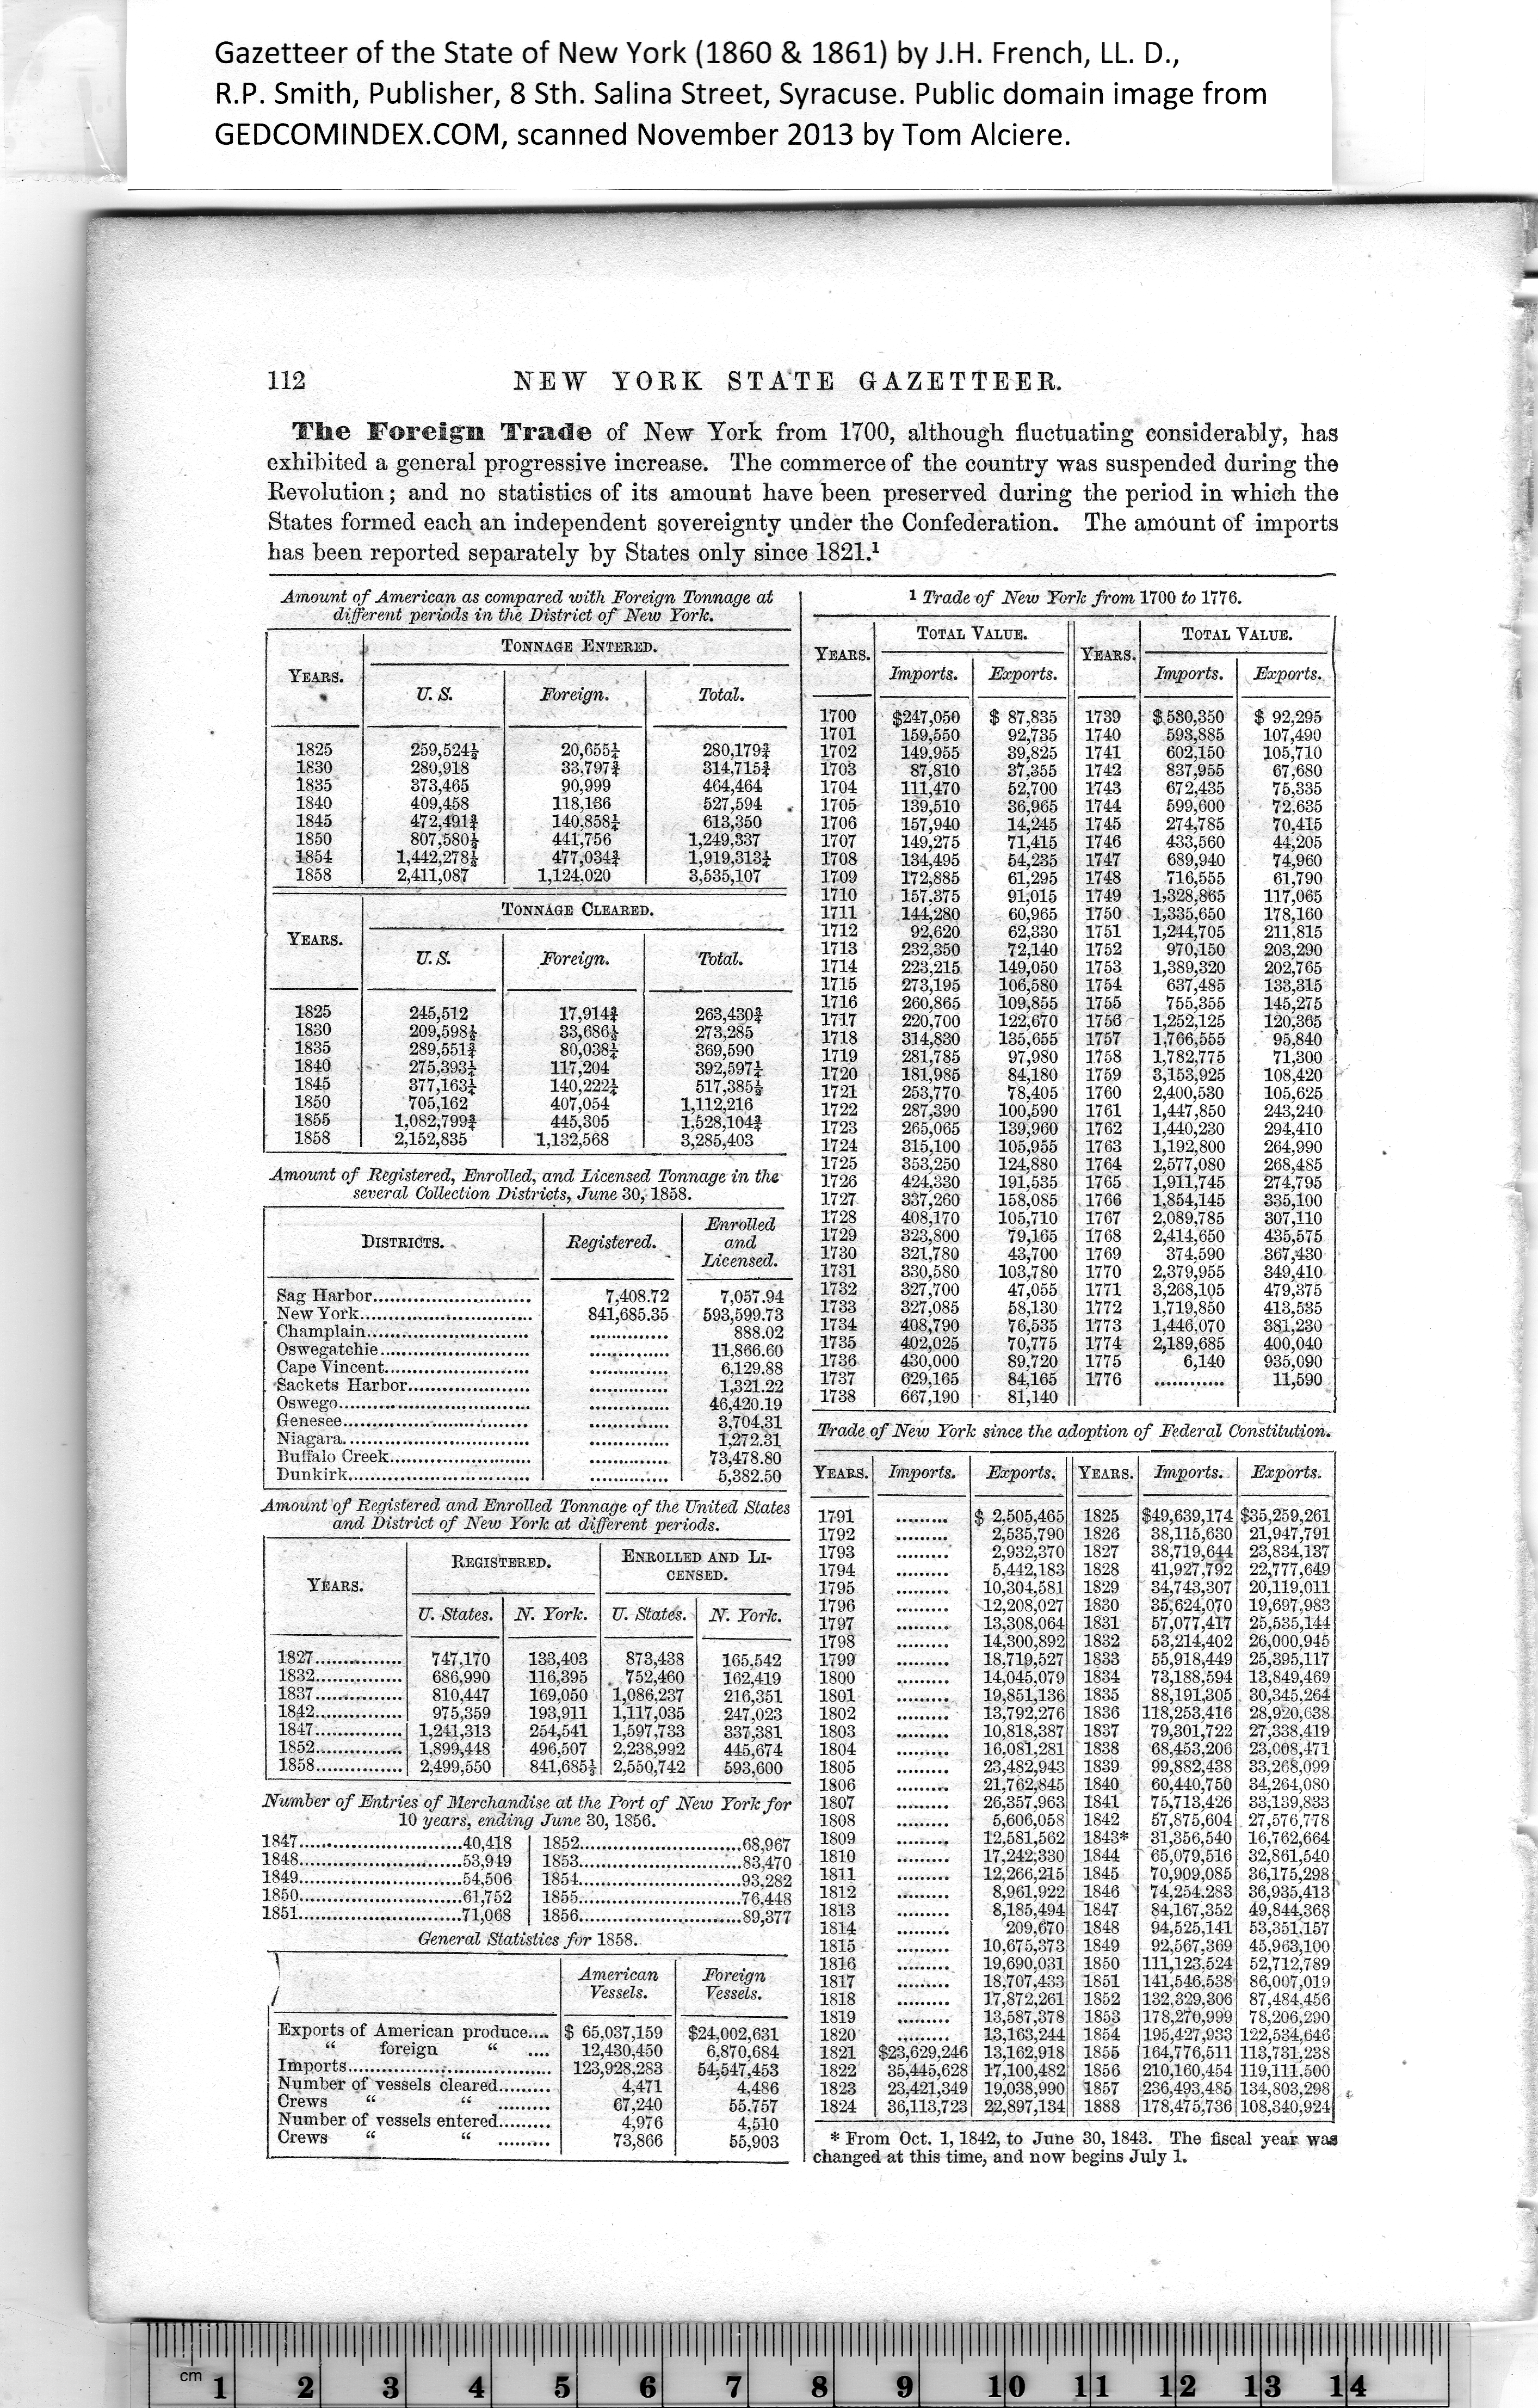
The Foreign Trade of New York from 1700, although fluctuating considerably, has
exhibited a general progressive increase. The commerce of the country was suspended during the
Revolution; and no statistics of its amount have been preserved during the period in which the
States formed each an independent sovereignty under the Confederation. The amount of imports
has been reported separately by States only since 1821.1
184 7............................40,418
185 2............................68,967
185 3............................83,470
185 4............................93.282
185 5............................76.448
185 6............................89,377
184 8............................53,949
184 9....... 54,506
185 0............................61,752
185 1............................71,068
|
General Statistics for 1858.. |
|
1 |
American
Vessels. |
Foreign
Vessels. |
|
Exports of American produce....
“ foreign “ ....
Imports.................................. |
$ 65,037,159
12,430,450
123,928,283
4,471
67,240
4,976
73,866 |
$24,002,631
6,870,684
54,547,453
4,486
55,757
4,510
65,903 |
|
Number of vessels cleared.........
Crews “ “ ......... |
|
Number of vessels entered.........
Crews “ “ ......... |
|
|
|
|
|
1 Trade of New York from 1700 to 1776. |
|
Tears. |
Total Value. |
Tears. |
Total Value. |
|
Imports. |
Exports. |
Imports. |
Exports. |
|
1700 |
$247,050 |
$ 87,835 |
1739 |
$ 5S0,350 |
$ 92,295 |
|
1701 |
159,550 |
92,735 |
1740 |
593,885 |
107,490 |
|
1702 |
149,955 |
39,825 |
1741 |
602,150 |
105,710 |
|
1703 |
87.810 |
37,355 |
1742 |
837,955 |
67,680 |
|
1704 |
111,470 |
52,700 |
1743 |
672,435 |
75,335 |
|
1705 |
139,510 |
36,965 |
1744 |
599,600 |
72.635 |
|
1706 |
157,940 |
14,245 |
1745 |
274,785 |
70.415 |
|
1707 |
149,275 |
71,415 |
1746 |
433,560 |
44,205 |
|
1708 |
134,495 |
54,2-35 |
1747 |
689,940 |
74,960 |
|
1709 |
172,885 |
61,295 |
1748 |
716,555 |
61,790 |
|
1710 |
157.375 |
91,015 |
1749 |
1,328,865 |
117,065 |
|
1711 |
144,280 |
60,965 |
1750 |
1,335,650 |
178,160 |
|
1712 |
92,620 |
62,830 |
1751 |
1,244,705 |
211,815 |
|
1713 |
232,350 |
72,140 |
1752 |
970,150 |
203.290 |
|
1714 |
228,215 |
149,050 |
1753 |
1,389,320 |
20^765 |
|
1715 |
273,195 |
106,580 |
1754 |
637,485 |
133,315 |
|
1716 |
260,865 |
109,855 |
1755 |
755,355 |
145,275 |
|
1717 |
220,700 |
122,670 |
1750 |
1,252,125 |
120.365 |
|
1718 |
314,830 |
135,655 |
1757 |
1,766,555 |
95,840 |
|
1719 |
281,785 |
97,980 |
1758 |
1,782,775 |
71,300 |
|
1720 |
181,985 |
84,180 |
1759 |
3,153,925 |
108,420 |
|
1721 |
253,770 |
78,405 |
1760 |
2,400,530 |
105,625 |
|
1722 |
287,390 |
100,590 |
1761 |
1,447,850 |
243,240 |
|
1723 |
265,065 |
139,960 |
1762 |
1,440,230 |
294,410 |
|
1724 |
315,100 |
105,955 |
1763 |
1,192,800 |
264.990 |
|
1725 |
353,250 |
124,880 |
1764 |
2,577,080 |
268,485 |
|
1726 |
424,330 |
191,535 |
1765 |
1,911,745 |
274,795 |
|
1727 |
337,260 |
158,085 |
1766 |
1,854,145 |
335,100 |
|
1728 |
408,170 |
105,710 |
1767 |
2,089,785 |
307,110 |
|
1729 |
323,800 |
79,165 |
1768 |
2,414,650 |
435,575 |
|
1730 |
321,780 |
43,700 |
1769 |
374.590 |
.367,430 |
|
1731 |
330,580 |
103,780 |
1770 |
2,379,955 |
349,410 |
|
1732 |
327,700 |
47,055 |
1771 |
3,268,105 |
479,375 |
|
1733 |
327,085 |
58,130 |
1772 |
1,719,850 |
413,535 |
|
1734 |
408,790 |
76,535 |
1773 |
1.446.070 |
381,230 |
|
1735 |
402,025 |
70,775 |
1774 |
2,189,685 |
400,040 |
|
1736 |
430,000 |
89,720 |
1775 |
6,140 |
935.090 |
|
1737 |
629,165 |
84,165 |
1776 |
|
11^90 |
|
1738 |
667,190 |
- 81,140 |
|
|
|
|
|
Trade of New York since the adoption of Federal Constitution. |
|
Tears. |
Imports. |
Exports, |
Tears. |
Imports. |
Exports. |
|
1791 |
|
$ 2.505,465 |
1825 |
$49,639,174 |
$35,259,261 |
|
1792 |
|
2,535,790 |
1826 |
38,115,630 |
21,947,791 |
|
1793 |
|
2,932,370 |
1827 |
38,719,644 |
23,834,137 |
|
1794 |
|
5.442,183 |
1828 |
41,927,792 |
22,777,649 |
|
1795 |
|
10,304,581 |
1829 |
34,743,307 |
20,119,011 |
|
1796 |
|
'-12,208,027 |
1830 |
35,624,070 |
19,697,983 |
|
1797 |
|
13,308,064 |
1831 |
57,077,417 |
25,535,144 |
|
1798 |
|
14,300,892 |
1832 |
53,214.402 |
26,000,945 |
|
1799 |
|
18,719,527 |
1833 |
55,918,449 |
25,395,117 |
|
1800 |
|
14,045.079 |
1834 |
73,188,594 |
13,849,469 |
|
1801 |
|
19,851,136 |
1835 |
88,191,305 |
. 30,345,264 |
|
1802 |
|
13,792,276 |
1836 |
118,253,416 |
28,920,638 |
|
1803 |
|
10,818,387 |
1837 |
79,301,722 |
27,338.419 |
|
1804 |
|
16,081.281 |
1838 |
68,453,206 |
23.008,471 |
|
1805 |
|
23,482,94-3 |
1839 |
99,882,438 |
33,268,099 |
|
1806 |
|
21,762,845 |
1840 |
60,440,750 |
34,264,080 |
|
1807 |
|
26,357,963 |
1841 |
75,713,426 |
33.139,833 |
|
1808 |
|
5,606,058 |
1842 |
57,875,604 |
. 27,576,778 |
|
1809 |
|
12,581,562 |
1843* |
31,356,540 |
16,762,664 |
|
1810 |
|
17,242,330 |
1844 |
65,079,516 |
32,861,540 |
|
1811 |
|
12,266,215 |
1845 |
70,909,085 |
36,175,298 |
|
1812 |
|
8,961,922 |
1846 ' |
74,254.283 |
36,935,413 |
|
1813 |
|
8,185,494 |
1847 |
84,167,352 |
49,844,368 |
|
1814 |
|
209,670 |
1848 |
94.525,141 |
53,351,157 |
|
1815 |
|
10,675,373 |
1849 |
92,567.369 |
45,963,100 |
|
1816 |
|
19,690,031 |
1850 |
111,123,524 |
52,712,789 |
|
1817 |
|
18,707,43-3 |
1851 |
141,546.538 |
86,007,019 |
|
1818 |
|
17,872,261 |
1852 |
132.329,306 |
87,484.456 |
|
1819 |
|
13,587,378 |
1853 |
178,270,999 |
78,206,290 |
|
1820 |
|
13,163,244 |
1854 |
195,427,933 |
122,534,646 |
|
1821 |
$23,629,246 |
13,162,918 |
1855 |
164,776,511 |
113,731.238 |
|
1822 |
35,445,628 |
17,100,482 |
1856 |
210,160,454 |
119,111.500 |
|
1823 |
23,421,349 |
19,038,990 |
1857 |
236,493,485 |
134.803,298 |
|
1824 |
36,113,723 |
22,897,134 |
1888 |
178,475,736 |
108,340,924 |
|
|
* Prom Oct. 1,1842, to June 30,1843. The fiscal year was
changed at this time, and now begins July 1. |
|