|
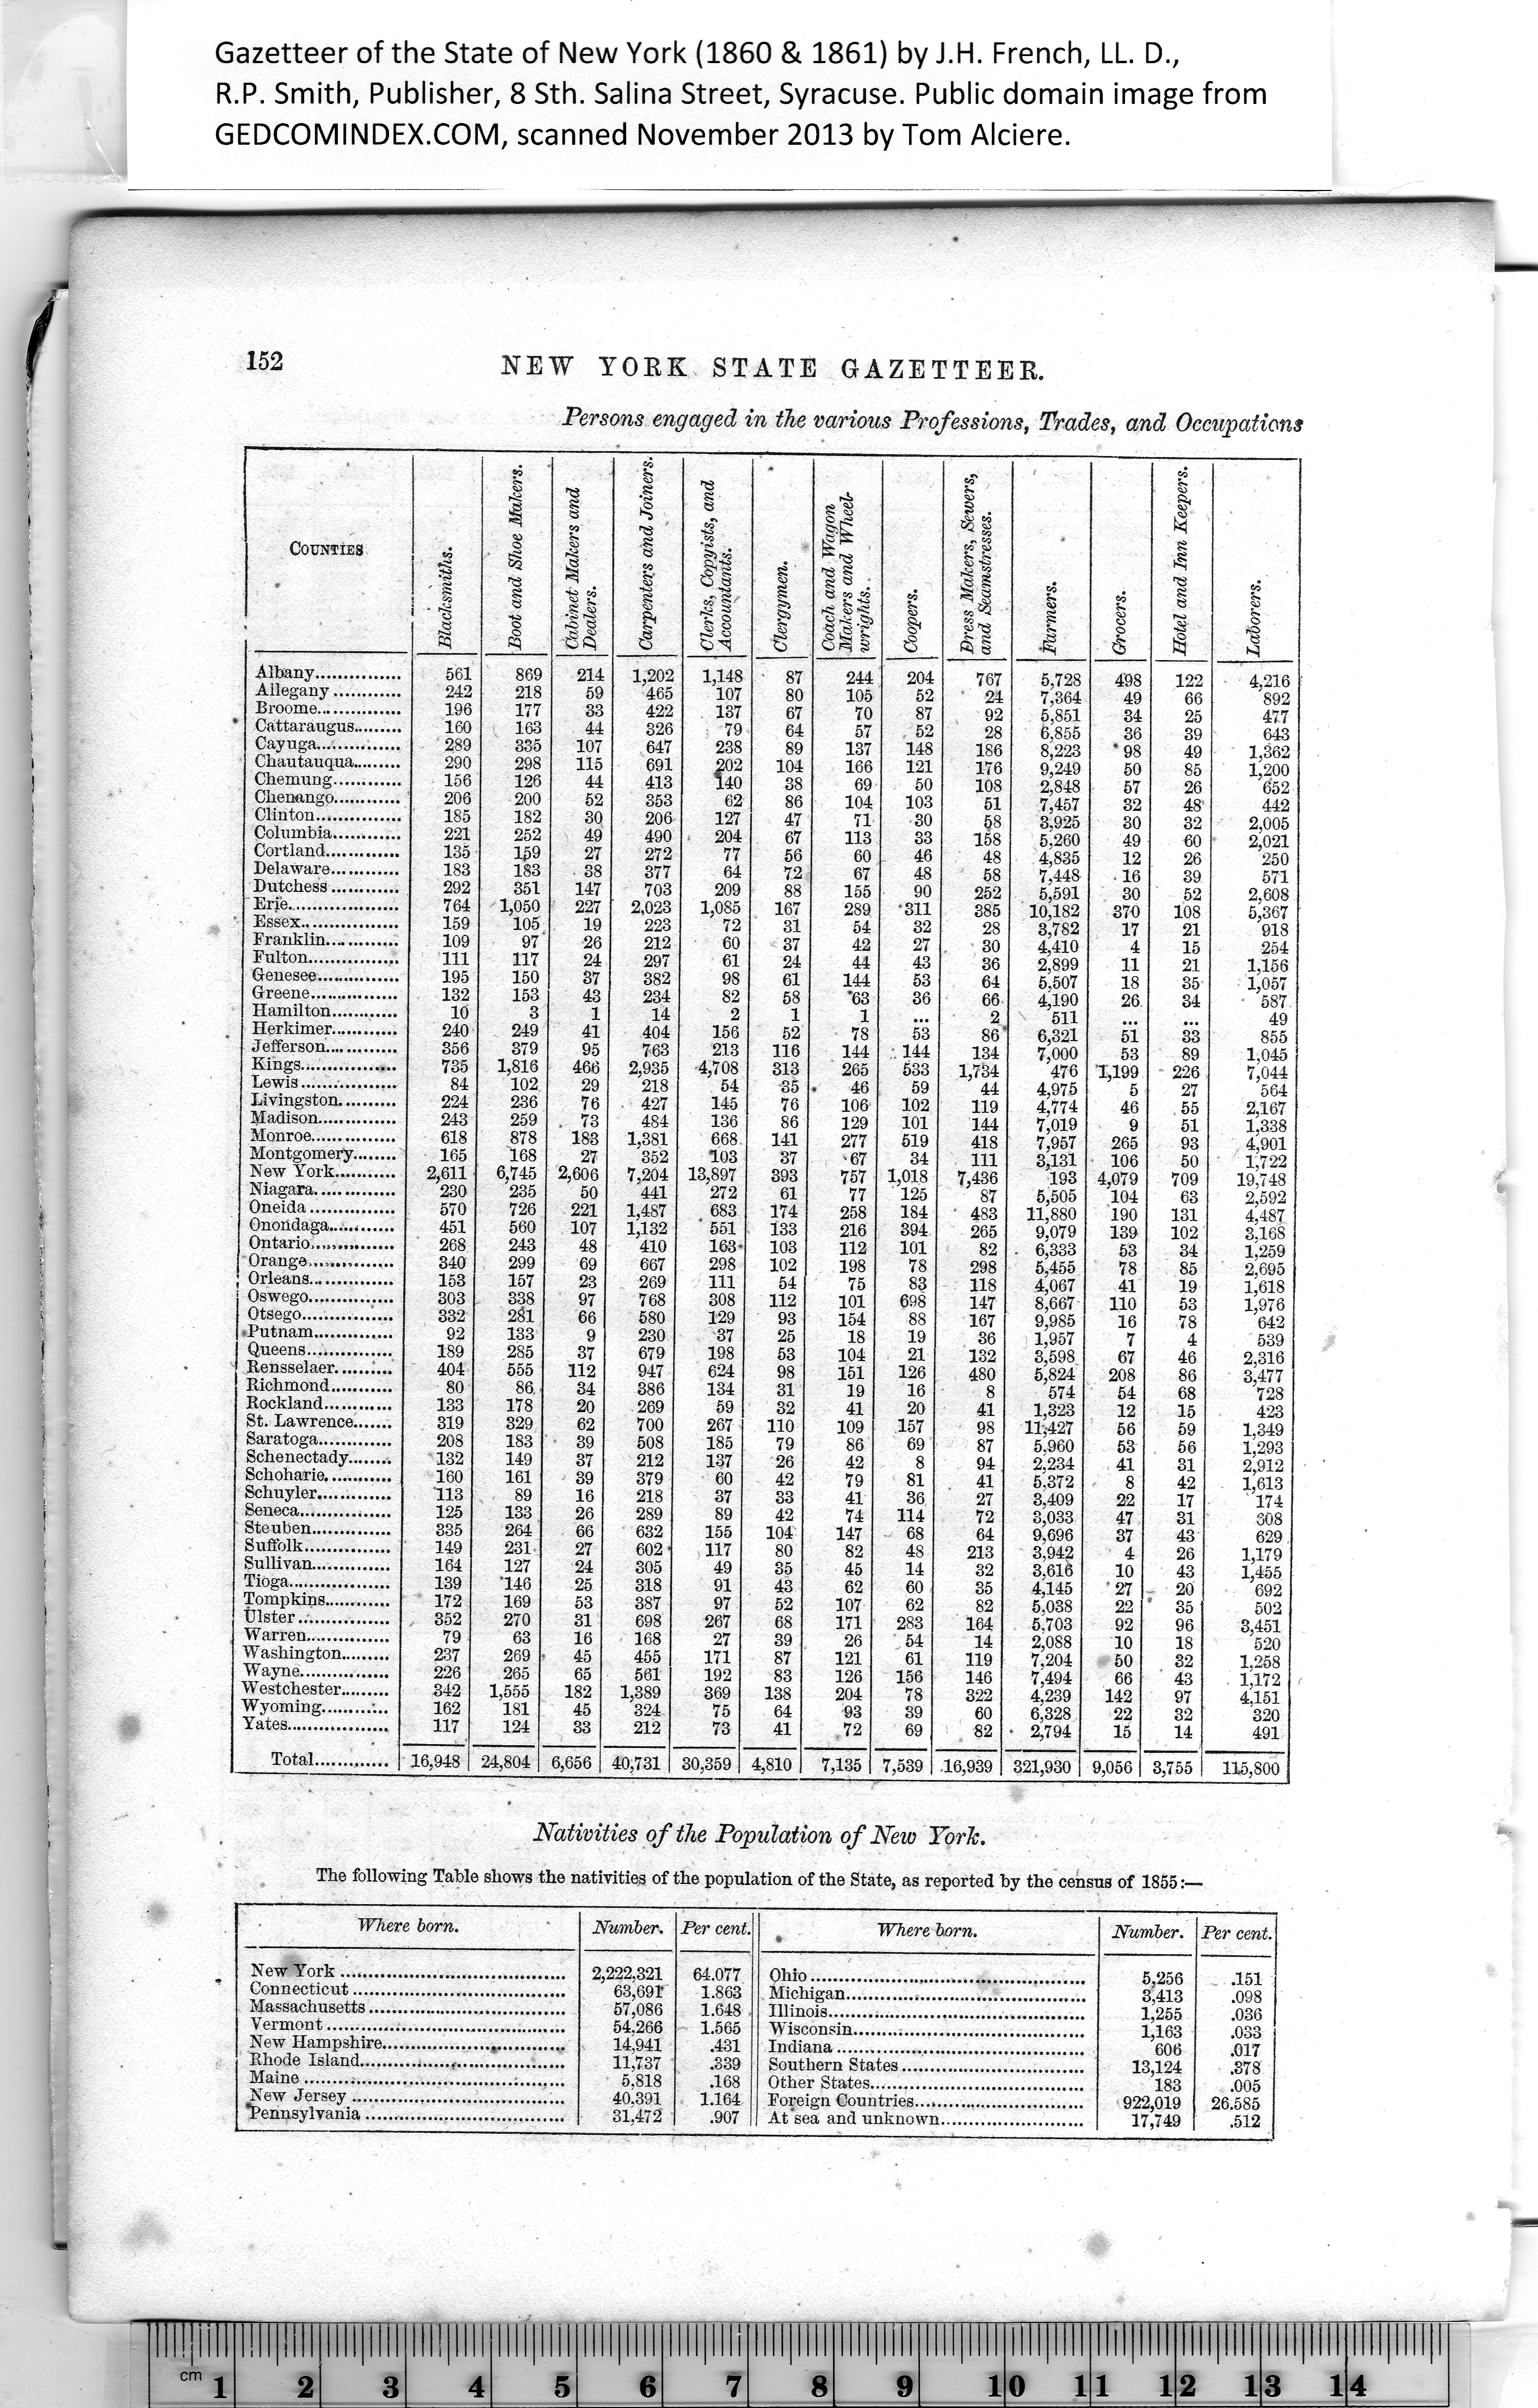
152 NEW YORK STATE GAZETTEER.
Persons engaged in the various Professions, Trades, and Occupations
|
Counties |
Blacksmiths. |
Boot and Shoe Makers. |
Cabinet Makers and
Dealers. |
j Carpenters and Joiners. |
Clerks, Copyists, and
Accountants. |
Clergymen.
' |
Coach and Wagon
Makers and Wheel-
i wrights.. |
£
§<
6 |
Dress Makers, Sewers,
and Seamstresses. |
S
•- |
Grocers. |
Hotel and Inn Keepers. |
Laborers. |
|
Albany............... |
561 |
869 |
214 |
1,202 |
1,148 |
■ 87 |
244 |
204 |
767 |
5,728 |
498 |
122 |
4,216 |
|
Allegany............ |
242 |
218 |
59 |
465 |
107 |
80 |
105 |
52 |
24 |
7,364 |
49 |
66 |
892 |
|
Broome............... |
196 |
177 |
33 |
422 |
137 |
67 |
70 |
87 |
92 |
5,851 |
34 |
25 |
477 |
|
Cattaraugus......... |
160 |
163 |
44 |
326 |
79 |
64 |
57 |
52 |
28 |
6,855 |
36 |
39 |
643 |
|
Cayuga............... |
289 |
335 |
107 |
647 |
238 |
89 |
137 |
148 |
186 |
8,223 |
*98 |
49 |
1,362 |
|
Chautauqua......... |
290 |
298 |
115 |
691 |
202 |
104 |
166 |
121 |
176 |
9,249 |
50 |
85 |
1,200 |
|
Chemung............ |
156 |
126 |
44 |
413 |
140 |
38 |
69 |
50 |
108 |
2,848 |
57 |
26 |
652 |
|
Chenango............ |
206 |
200 |
52 |
353 |
62 |
86 |
104 |
103 |
51 |
7,457 |
32 |
48 |
442 |
|
Clinton............... |
185 |
182 |
30 |
206 |
127 |
47 |
71 |
30 |
§8 |
3,925 |
30 |
32 |
2,005 |
|
Columbia............ |
221 |
252 |
49 |
490 |
• 204 |
67 |
113 |
33 |
158 |
5,260 |
49 |
60 |
2,021 |
|
Cortland............. |
135 |
lp9 |
27 |
272 |
77 |
56 |
60 |
46 |
48 |
4,835 |
12 |
26 |
250 |
|
Delaware............ |
183 |
183 |
38 |
377 |
64 |
72 |
67 |
48 |
58 |
7,448 |
• 16 |
39 |
571 |
|
Dutchess............ |
292 |
351 |
147 |
703 |
209 |
88 |
155 |
90 |
252 |
5,591 |
30 |
52 |
2,608 |
|
Erie.................... |
764 |
1,050 |
227 |
2,023 |
1,085 |
167 |
289 |
•311 |
385 |
10,182 |
370 |
108 |
5,367 |
|
Essex................. |
159 |
105 |
19 |
223 |
72 |
31 |
54 |
32 |
28 |
3,782 |
17 |
21 |
918 |
|
Franklin.—......... |
109 |
97 |
26 |
212 |
60 |
37 |
42 |
27 |
30 |
4,410 |
4 |
15 |
254 |
|
Fulton................ |
111 |
117 |
24 |
297 |
61 |
24 |
44 |
43 |
36 |
2,899 |
11 |
21 |
1,156 |
|
Genesee............... |
195 |
150 |
37 |
382 |
98 |
61 |
144 |
53 |
64 |
5.507 |
18 |
35 |
1,057 |
|
Greene................ |
132 |
153 |
43 |
234 |
82 |
58 |
*63 |
36 |
66 |
4,190 |
26 |
34 |
■ 587 |
|
Hamilton............ |
10 |
3 |
1 |
14 |
2 |
1 |
1 |
|
2 |
511 |
|
|
49 |
|
Herkimer............ |
240 |
. 249 |
41 |
404 |
156 |
52 |
78 |
53 |
86 |
6,321 |
51 |
33 |
855 |
|
Jefferson............. |
356 |
379 |
95 |
763 |
213 |
116 |
144 |
. 144 |
134 |
7,000 |
53 |
89 |
1,045 |
|
Kings................. |
735 |
1,816 |
466 |
2,935 |
■4,708 |
313 |
265 |
533 |
1,734 |
476 |
1,199 |
226 |
7,044 |
|
Lewis................. |
84 |
102 |
29 |
218 |
54 |
35 |
46 |
59 |
44 |
4,975 |
5 |
27 |
564 |
|
Livingston.......... |
224 |
236 |
76 |
• 427 |
145 |
76 |
106 |
102 |
119 |
4,774 |
46 |
55 |
2,167 |
|
Madison.............. |
243 |
259 |
. 73 |
484 |
136 |
86 |
129 |
101 |
144 |
7,019 |
9 |
51 |
1.338 |
|
Monroe............... |
618 |
878 |
183 |
1,381 |
668 |
141 |
277 |
519 |
418 |
7,957 |
265 |
93 |
4,901 |
|
Montgomery........ |
165 |
168 |
27 |
352 |
103 |
37 |
-67 |
34 |
111 |
3,131 |
106 |
50 |
1,722 |
|
New York........... |
2,611 |
6,745 |
2,606 |
7,204 |
13,897 |
393 |
757 |
1,018 |
7,436 |
193 |
4,079 |
709 |
19,748 |
|
Niagara.............. |
230 |
235 |
50 |
441 |
272 |
61 |
77 |
125 |
87 |
5,505 |
104 |
63 |
2,592 |
|
Oneida............... |
570 |
726 |
221 |
1,487 |
683 |
174 |
258 |
184 |
• 483 |
11,880 |
190 |
131 |
4,487 |
|
Onondaga............ |
451 |
560 |
107 |
1,132 |
551 |
133 |
216 |
394 |
265 |
9.079 |
139 |
102 |
3,168 |
|
Ontario............... |
268 |
243 |
48 |
410 |
163- |
103 |
112 |
101 |
82 |
. 6,333 |
53 |
34 |
1,259 |
|
Orange,,.,........... |
340 |
299 |
69 |
667 |
298 |
102 |
198 |
78 |
298 |
5.455 |
78 |
85 |
2,695 |
|
Orleans............... |
153 |
157 |
23 |
269 |
111 |
54 |
75 |
83 |
118 |
4,067 |
41 |
19 |
1,618 |
|
Oswego............... |
303 |
338 |
97 |
768 |
308 |
112 |
101 |
698 |
147 |
8,667 |
110 |
53 |
1,976 |
|
Otsego................ |
332 |
281 |
66 |
580 |
129 |
93 |
154 |
88 |
167 |
9,985 |
16 |
78 |
642 |
|
•Putnam.............. |
92 |
133 |
9 |
230 |
37 |
25 |
18 |
19 |
36 |
1,957 |
7 |
4 |
539 |
|
Queens............... |
189 |
285 |
37 |
679 |
198 |
53 |
104 |
21 |
132 |
3,598 |
67 |
46 |
2,316 |
|
Rensselaer.......'... |
404 |
555 |
112 |
947 |
624 |
98 |
151 |
126 |
480 |
6,824 |
208 |
86 |
3,477 |
|
Richmond........... |
80 |
86. |
34 |
386 |
134 |
31 |
19 |
16 |
8 |
574 |
54 |
68 |
728 |
|
Rockland............ |
133 |
178 |
20 |
269 |
59 |
32 |
41 |
20 |
41 |
1,323 |
12 |
15 |
423 |
|
St. Lawrence....... |
319 |
329 |
62 |
700 |
267 |
110 |
109 |
157 |
98 |
IT,- 427 |
56 |
59 |
1.349 |
|
Saratoga............. |
208 |
183 |
• 39 |
508 |
185 |
79 |
86 |
69 |
87 |
5.960 |
53 |
56 |
1,293 |
|
Schenectady........ |
132 |
149 |
37 |
212 |
137 |
26 |
42 |
8 |
94 |
2.234 |
41 |
31 |
2,912 |
|
Schoharie............ |
160 |
161 |
39 |
379 |
60 |
42 |
79 |
81 |
41 |
5,372 |
8 |
42 |
1,613 |
|
Schuyler............. |
113 |
89 |
16 |
218 |
37 |
33 |
41 |
36 |
27 |
3.409 |
22 |
17 |
174 |
|
Seneca................ |
125 |
133 |
26 |
289 |
89 |
42 |
74 |
114 |
72 |
3,033 |
47 |
31 |
308 |
|
Steuben.............. |
335 |
264 |
66 |
632 |
155 |
104 |
147 |
68 |
64 |
9,696 |
37 |
43 |
629. |
|
Suffolk............... |
149 |
231 |
27 |
602' |
117 |
80 |
82 |
48 |
213 |
3,942 |
4 |
26 |
1,179 |
|
Sullivan.............. |
164 |
127 |
24 |
305 |
49 |
35 |
45 |
14 |
32 |
3.616 |
10 |
43 |
1,455 |
|
Tioga.................. |
139 |
’146 |
25 |
318 |
91 |
43 |
62 |
60 |
35 |
4,145 |
‘27 |
_ 20 |
692 |
|
Tompkins............ |
172 |
169 |
53 |
387 |
97 |
52 |
107 |
62 |
82 |
5,038 |
22 |
* 35 |
502 |
|
Ulster................ |
352 |
270 |
31 |
698 |
267 |
68 |
171 |
283 |
164 |
5.703 |
92 |
96 |
3,451 |
|
Warren............... |
79 |
63 |
16 |
168 |
27 |
39 |
26 |
54 |
14 |
2,088 |
10 |
18 |
520 |
|
Washington......... |
237 |
269 |
45 |
455 |
171 |
87 |
121 |
61 |
119 |
7,204 |
50 |
32 |
1.258 |
|
W ayne................ |
226 |
265 |
65 |
561 |
192 |
83 |
126 |
156 |
146 |
7,494 |
66 |
43 |
1,172 |
|
Westchester......... |
342 |
1,555 |
182 |
1,389 |
369 |
138 |
204 |
78 |
322 |
4,239 |
142 |
97 |
4.151 |
|
Wyoming.........:.. |
162 |
181 |
45 |
324 |
75 |
64 |
93 |
39 |
60 |
6,328 |
22 |
32 |
320 |
|
Yates.................. |
117 |
124 |
33 |
212 |
73 |
41 |
.72 |
69 |
82 |
• 2,794 |
15 |
14 |
491 |
|
Total............. |
16,948 |
24,804 |
6,656 |
40,731 |
30,359 |
4,810 |
7,135 |
7,539 |
.16,939 |
321,930 |
9,056 |
3,755 |
115,800 |
Nativities of the Population of New York.
The following Tahle shows the nativities of the population of the State, as reported by the census of 1855:—
|
Where born. |
Number. |
Per cent. |
Where born. |
Number. |
Per cent. |
|
New York.......................................
Connecticut.....................................
Massachusetts...................................
Vermont..........................................
New Hampshire...................*............
Rhode Island..........,.........................
Maine.........-...........................
New Jersey.....................................
"Pennsylvania................................... |
2,222,321
63,691
57,086
54.266
14.941
11,737
5,818
40.391
31.472 |
64.077
1.863
1.648 .
1.565
.431
.339
.168
1.164
.907 |
Ohio................................................
Michigan..........................................
Illinois.............................................
Wisconsin........................................
Indiana...........................................
Southern States................................
Other States.....................................
Foreign Countries..............................
At sea and unknown......................... |
5,256
3,413
1,255
1,163
606
13,124
183
922,019
17,749 |
.151
.098
.036
.033
.017
.378
.005
26.585
.512 |
|